Presentation posted on Apr 9, 2017


The Semiconductor industry has long embraced Fault Detection and Classification (FDC) as a critical tool for analyzing process tool performance in order to monitor uptime, optimize process recipes, and improve manufacturing yields. Advances in data collection methods have increased the amount of data that may be recorded from the tool, the data resolution, and the reliability of this data extraction. All of these technical developments have provided equipment and process engineers with a huge volume of potentially useful data. Consequently, semiconductor engineers sift through this data to create many libraries of charts and reports to track various critical sensors from the tool. In many cases the charts reveal opportunities for optimization, or pinpoint the root cause for some yield loss. However, building these charts takes resources, and analyzing the resultant charts takes additional resources. An often-overlooked consideration is data processing, or fine-tuning to collect only data during the critical steps, rather than just collecting all of the data, regardless of its impact on the process. For an engineer, finding the silver bullet can be an arduous task of examining pages upon pages of charts on a daily basis. In other words, process tool monitoring challenges has shifted from simply collecting the tool’s data, to intelligently collecting, processing, and visualizing the data. With useful charts in hand, engineers may now enter the era of Predictive Analytics. The ability to predict a tool failure/need for preventative maintenance requires process and tool know-how. Therefore, the most sophisticated and valuable FDC systems use both process, and tool knowledge to create a Predictive Analytics system.
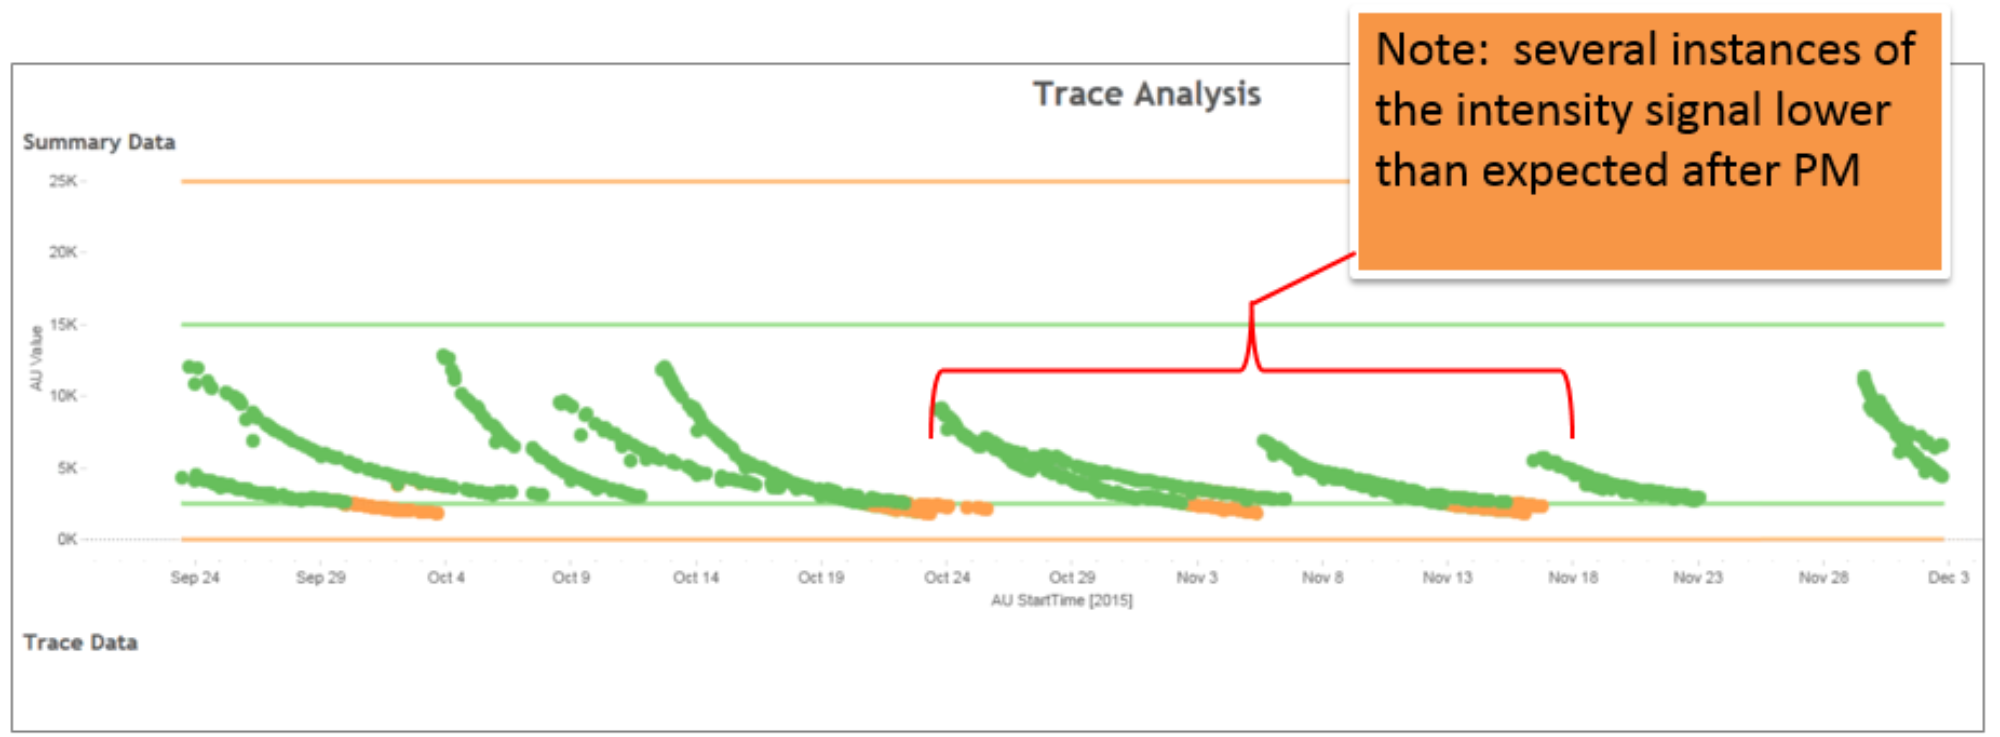
In this abstract, we propose a simple, yet intuitive user interface that combines traditional FDC data with a tool manufacture’s deep hardware/component knowledge/expertise to provide powerful predictive capabilities. By creating predictive models using FDC sensor data and organizing it in a simple dashboard, users are able to track tool health and performance in real-time in a matter of seconds, as opposed to minutes or hours to analyze charts. The results in this abstract are real cases using Rudolph Predictive Analytics connected to a Veeco IBE tool in a production environment.