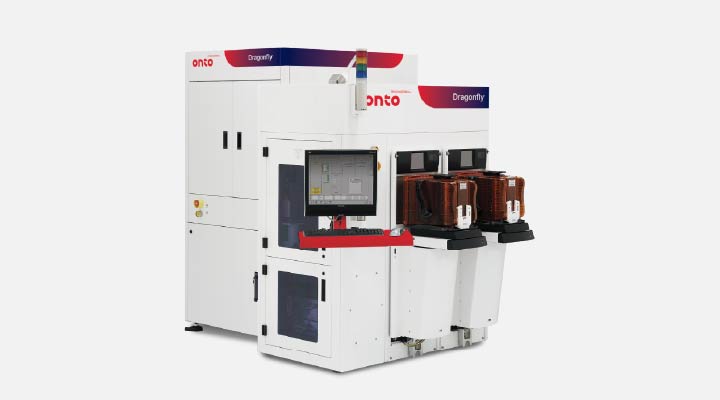
Dragonfly® G3 System
Highly configurable, automated, high speed 2D inspection and 3D metrology for inline process control in advanced packaging, specialty and front-end OQA.


Every day, consumers rely on an invisible network of specialty semiconductor devices without realizing it. The smartphone in your pocket is a good place to start.

May 27 — May 28, 2026
Onto Innovation is a proud exhibitor at IEEE 76th Electronic Components and Technology Conference.
From the cars we drive to the devices we hold and the medical systems that safeguard our health, bipolar-CMOS-DMOS (BCD) technology is at the heart of many modern electronics.
Today’s vehicles are packed with electronics like power engine management, anti-lock braking systems (ABS), airbag controllers, and electric vehicle (EV) charging infrastructure, each one demanding a seamless integration of analog, digital, and power functions. In the case of smartphones, audio amplifiers, and smart home devices, BCD devices help balance power efficiency with high performance. Meanwhile, medical imaging systems, such as ultrasound, and advanced power management solutions, rely on semiconductor technologies like BCD devices to handle diverse electrical requirements without compromising accuracy or safety.
Important as BCD devices may be, what exactly are they?
BCD devices are an advanced semiconductor process technology that integrates three distinct types of transistors—bipolar, CMOS, and DMOS—onto a single chip. The integration of these three transistors enables the simultaneous handling of analog, digital, and power functions within a compact and high-performance platform, with each transistor type contributing unique strengths:
For BCD devices to meet performance expectations, proper process control measures are needed, especially in the case of silicon-chromium (SiCr) thin films.
SiCr films play a critical role in BCD technology, primarily as precision resistive elements within analog and power management circuits (Figure 1.). SiCr resistors offer high stability, low temperature coefficient resistance (TCR), and excellent linearity, making them ideal for applications requiring accurate voltage and current control. Given the stringent reliability standards for BCD technology as demanded by the automotive industry and others, SiCr deposition must exhibit high reproducibility and minimal defectivity to support high-yield manufacturing and robust device performance under thermal and electrical stress.

Figure 1. Schematic of the BCD process, with SiCr film identified.
Uniformity across the wafer and repeatability between lots are critical. After all, minor thickness or compositional variations can lead to resistance drift which impacts analog accuracy and long-term reliability. Tight process control during the deposition step—including chamber stability, target conditioning, and plasma uniformity—ensures consistent film morphology and stoichiometry.
During SiCr sputtering, the precise regulation of specialty gas flow, in particular reactive gases such as nitrogen or oxygen, is critical, as their partial pressures influence plasma chemistry and the kinetics of silicide formation on the substrate. This silicide layer governs nucleation and grain growth, which directly affects grain boundary spacing and, consequently, TCR. Variations in gas flow can alter the stoichiometry and microstructure of the SiCr film, leading to shifts in TCR behavior, including the onset of a pronounced negative coefficient if the process is not tightly controlled.
Given the importance of these demands, manufacturers need the right tools on hand to maintain proper process control and optimize the performances of their BCD devices. In this article we will discuss the application of picosecond ultrasonic technology in two parts: one as a robust thickness metrology solution for qualifying SiCr deposition process and the second for excursion monitoring in BCD devices.
About Picosecond Ultrasonic Technology
Picosecond ultrasonic technology (PULSE™ technology) is a non-contact, non-destructive pump-probe laser acoustic technique for the measurement of metal film thickness. It is a proven workhorse in semiconductor fabs around the world. A 0.1ps laser pulse (pump) is focused to a small (~ 8´10mm2) spot onto a wafer surface to create a sharp acoustic wave. The acoustic wave travels away from the surface through the film at the speed of sound. At the interface with another material, a portion of the acoustic wave is reflected and comes back to the surface while the rest is transmitted. The probe pulse detects this reflected acoustic wave as it reaches the wafer surface. One can detect the change of optical reflectivity that is caused by the strain of the acoustic wave or alternatively detect, using a position sensitive detector (PSD), the deflection of the reflected probe beam that is caused by the deformation of the surface due to the acoustic wave. Both modes, reflectivity (REF) and PSD, are used in characterizing metal films. Knowing the speed of sound in the material, and the arrival time of the echoes, thickness is readily extracted using the first principles technique.
Film Thickness
With background on picosecond ultrasonic technology out of the way, we will turn our attention to the application of this technology as a robust thickness metrology solution for qualifying SiCr deposition process in BCD devices. To demonstrate this, we measured the nominal thickness of SiCr thin films using picosecond ultrasonic technology.
Figure 2a shows the raw data from the SiCr thin film. The acoustic echoes identified in the figure are used to calculate the thickness of the film using the speed of sound and round-trip transit time through the film. Nominally, textbook values for the longitudinal speed of sound would be used. In the case of SiCr films, the longitudinal speed of sound will vary from the bulk material and depend on the deposition process (sputtering, evaporation, etc.) and specific film composition (stoichiometry, density, etc.).
As a one-time calibration, we used cross-section transmission electron microscopy (TEM) to obtain SiCr film thickness and calculated the speed of sound for this specific process to be 69.7Å/ps. The modeled fit to the measurement is shown in Figure 2b.

Figure 2a. Raw data of reflectivity change vs time shown. The cross-wafer variation is identified by the shift in acoustic echoes.

Figure 2b. Modeled fit to measured data shown. The green curve represents the measurement, and the black curve represents the fit.
In Figure 3a, raw data from the DOE skew is shown. The shift in echo position between the different wafers demonstrates the sensitivity of the technique for monitoring the process. Within wafer uniformity profiles from 13 points across the wafer show consistent trends (Figure 3b).
Given the critical function of SiCr films in BCD device architecture, it is imperative to maintain highly uniform deposition with stringent process control to meet electrical and reliability specifications. Yield optimization is directly correlated with film uniformity as variations can significantly degrade device performance and long-term stability. As part of chamber qualification, more extensive sampling across the wafer, including to the edge, was performed (Figure 4). Those profiles are also consistent across the thickness skew.

Figure 3a. Raw data from the DOE thickness skew. Delta represents the skew in thickness from the target. The shift in echo position demonstrates the sensitivity for process monitoring

Figure 3b. Consistent cross wafer uniformity profiles for the three wafers.
Repeatability is a key metric in SiCr thin film metrology for ensuring robust process control and consistent device performance. Poor repeatability can obscure true process shifts, leading to incorrect corrective actions and potential yield loss. Gage capable repeatability measurements ensure compliance with automotive industry standards and are critical for long-term reliability. The dynamic repeatability data indicates performance is better than 0.5Å (1σ) and is more than sufficient to meet the process monitoring needs.

Figure 4. Forty-nine point wafer uniformity profiles for the three wafers, including measurements to the edge of the wafer. The profiles were consistent across the entire wafer.
As demonstrated, picosecond ultrasonic technology provides a precise, non-destructive method for measuring film thickness, validated against TEM calibration. The technique also offers exceptional repeatability and sensitivity, enabling manufacturers to monitor wafer-to-wafer and within-wafer uniformity with confidence. This capability is critical for maintaining tight process windows, as even minor deviations in thickness can lead to resistance drift and compromise analog precision. By integrating this metrology into chamber qualification and process monitoring, fabs can ensure consistent SiCr deposition, optimize yield, and meet stringent reliability standards.
Film quality
In picosecond ultrasonic technology, acoustic echoes are used to calculateSiCr film thickness. However, simultaneously available probe reflectivity data can be leveraged to provide information that can be used for process optimization (i.e., gas flow) and flagging process excursions. As such, this technique can be used to monitor the surface reflectivity of SiCr films; this application serves as a qualitative indicator of the film morphology and surface roughness and can be used for process control.


Figure 5. Surface reflectivity comparison for films having same target thickness but different reflectivity. Average reflectivity variation (top) across wafer is much higher than the thickness variation (bottom). Orange represents the lower flow rate, and blue represents the higher flow rate.
During the sputtering of SiCr films, gas flow has a strong influence on TCR as it impacts the film’s microstructure and stoichiometry (density and composition). This, in turn, determines the film’s stability, stress, and electromigration resistance in BCD applications. Uneven gas distribution causes local variations in thickness and composition leading to resistor mismatches and unpredictable TCR.
The surface reflectivity of the target wafer at two different gas flow rates is shown in Figure 5. Reflectivity data was collected at the same time as the acoustic data and shows the variation in surface reflectivity. At gas flow rate (b), the surface was more reflective corresponding to a smooth, dense film, whereas at flow rate (a), the reduced reflectivity indicates increased surface roughness which can degrade resistor uniformity and TCR stability.
Also, the thickness variation SiCr film is thinner at the higher N2 flow. N2 is known to affect silicide/nitride formation, grain spacing, etc., and impact both thickness and reflectivity. Studies are underway to characterize the impact of annealing temperature. The results are promising.
In summary, the surface quality of SiCr films plays an equally critical role in device stability and long-term performance. The study highlights how reflectivity measurements, captured alongside thickness data using the same picosecond ultrasonic platform, serve as a powerful indicator of film morphology and density. Variations in gas flow during sputtering were shown to significantly influence both reflectivity and thickness, underscoring the importance of precise control over deposition parameters. A smoother, more reflective surface correlates with improved resistor uniformity and predictable TCR behavior, while rougher films can degrade electrical performance.
Based on these results, we have demonstrated that reflectivity measurements, along with thickness measurements, can be leveraged for in-line monitoring to detect deviations in deposition parameters. By leveraging dual metrics—thickness and reflectivity—manufacturers gain a comprehensive, in-line process control solution that enables early detection of excursions and proactive corrections, ensuring robust SiCr thin film integration in advanced BCD architectures.
Conclusion
From automotive safety systems to medical imaging and consumer electronics, BCD technology enables the seamless integration of analog, digital, and power functions that modern applications demand. Yet, this versatility hinges on precise control of SiCr thin films whose stability and uniformity directly influence device reliability
Achieving this level of integration comes with significant manufacturing challenges, particularly in controlling SiCr film thickness and gas flow during sputtering, factors which directly impact resistor stability and temperature performance, which are critical for reliability in demanding environments. To overcome these hurdles, we propose using picosecond ultrasonic technology.
With picosecond ultrasonic technology, manufacturers have a powerful, non-destructive tool for monitoring thickness and reflectivity at the ready, one that ensures that SiCr films meets stringent performance standards. In doing so, manufacturers will be able to safeguard the integrity of BCD devices while supporting the continued evolution of new technologies across the automotive, medical, and consumer electronics sectors.
By Huayuan Li, Alex Hong, Johnny Mu, Timothy Kryman, and Priya Mukundhan
We’d love to connect with you.
Looking to learn more about our innovative solutions and capabilities? Our team of experts is ready to assist you. Reach out today and let’s starts a conversation about how we can help you achieve your goals.
"*" indicates required fields
Picosecond Ultrasonics (PULSE™) Technology has emerged as a leading metrology solution for characterizing single-layer and multilayer metal films in advanced semiconductor manufacturing [1]. As a non-contact, non-destructive technique, PULSE Technology has become the tool-of-record across multiple device segments, including logic, radio frequency (RF), memory, microelectromechanical systems (MEMS), and flash memory. Its ability to measure both film thickness and elastic modulus [2,3] in-line makes it indispensable for process control and material characterization.
Backside metallization (BSM) is essential in semiconductor fabrication, particularly for power electronics, logic ICs, and advanced memory devices. It involves depositing metal layers on the wafer’s reverse side to improve electrical conductivity, thermal dissipation, and mechanical stability. As device architecture becomes more complex, precise control and measurement of BSM layers are critical for ensuring performance and reliability. Driven by demand from semiconductors, photovoltaic, MEMS, and LED sectors, the BSM market is expanding rapidly [4]. Technologies such as PVD, CVD, electroplating, and sputtering enable tailored metal stacks, but they also pose metrology challenges—especially for non-destructive, multilayer characterization. These metal layers typically range from 50 nm to 3 µm in thickness, with total stack thicknesses reaching up to 5 µm.
Accurate characterization of BSM layers is essential for ensuring device reliability, performance, and manufacturing yield. Traditional metrology techniques such as scanning electron microscopy (SEM), atomic force microscopy (AFM), four-point probe, X-ray reflectometry (XRR), and X-ray fluorescence (XRF) often face limitations in throughput, destructiveness, thickness limitations, or sensitivity to surface roughness. In contrast, Picosecond Ultrasonics offers a compelling alternative, providing high-precision measurements across a wide thickness range with micron-scale spatial resolution. Its ability to simultaneously resolve multiple layers in a single measurement, even on rough or non-planar surfaces, makes it particularly well-suited for BSM applications.
In this paper, we demonstrate the application of Picosecond Ultrasonics to backside metallization metrology. We present data showing its capability to measure both single-layer and multilayer metal stacks with excellent repeatability, long-term stability, and high throughput. The technology’s small spot size—on the order of microns—enables measurements on small pads as small as 15 µm, improving spatial resolution and enabling in-line monitoring on product wafers. Furthermore, advanced features such as dual modulation, crossed polarization, and adaptive measurement controls enhance performance on challenging surfaces, including aluminum and complex BSM stacks.
We’d love to connect with you.
Looking to learn more about our innovative solutions and capabilities? Our team of experts is ready to assist you. Reach out today and let’s starts a conversation about how we can help you achieve your goals.
"*" indicates required fields
Surface Relief Grating (SRG) waveguides have been adopted as the mainstream solution in the industry, for its slim profile, high transparency, and large field of view. Furthermore, with their superior optical performance and mass production potential, SRG waveguides have emerged as a critical pathway for high‑performance augmented reality (AR) and mixed reality (MR) displays. In the mass production of SRG optical waveguides, where multi‑layer and double‑sided fabrication demand strict process control of overlay, geometry, and defects. We present a full process control solution for SRG mass production, combining optical critical dimension (OCD) metrology for the critical parameters of SRGs such as the grating depth, slanted angle, and periods, picosecond ultrasonic (PULSE™) technology for the metal film thickness measurement, image‑based overlay (IBO) on the IVS™ platform for precise overlay control, automated optical inspection based Dragonfly® system for the defects integrated throughout the entire SRG manufacturing process. OCD shows sub‑nanometer deviation and excellent matching with AFM, with high dynamic stability. PULSE™ technology ensures rapid, non‑contact measurement and uniformity control of chromium (Cr) and aluminum (Al) hard masks. Overlay precision reaches 0.26 nm (X) and 0.18 nm (Y) at 3σ, well within sub‑100 nm alignment requirements. Automated inspection captures >95% of submicron defects with low false positives. This framework has been validated in mass production at leading AR/MR manufacturers, enabling fully digitalized closed‑loop process control and supporting large‑scale, high‑yield SRG waveguide manufacturing.
We’d love to connect with you.
Looking to learn more about our innovative solutions and capabilities? Our team of experts is ready to assist you. Reach out today and let’s starts a conversation about how we can help you achieve your goals.
"*" indicates required fields
Specialty devices are the unsung heroes of modern life. For many in the semiconductor industry today, the spotlight is on the SiC and GaN power devices used in automotive, green energy, fast-charge consumer electronics (CE), and high-performance computing (HPC) applications (Figures 1 and 2).
However, specialty devices are more than just power devices. They are a broad class of semiconductor components delivering a variety of functions across multiple industry segments, including microelectromechanical systems (MEMS) in automobiles and CE to radio frequency (RF) filters for 5G/6G communications.

Figure1: Planar SiC MOSFET and trench SiC MOSFET

Figure 2: Vertical GaN and GaN on Si high electron mobility transistor (HEMT)
Photonics are another type of specialty device making industry waves. Previously viewed as something of a dark horse in the specialty sphere, photonics have made a comeback. Today, photonics are being used for 3D sensing in multiple CE applications such as smartphone user verification and 3D imaging, automotive applications in which scanning lasers are used in advanced driver assistance systems (ADAS); and telecommunications applications where photonics have long been used as optical transceivers supporting the conversion of copper wiring to optical fiber communications in data centers. While these applications and others exist for photonics, the killer photonics application is shaping up to be co-packaged optics (CPO), which enables optical communications directly from packaged XPU devices supporting AI applications.
When it comes to the broad category of specialty devices, nearly all of them are either manufactured on or previously manufactured on 150mm or 200mm wafers. However, specialty devices are moving to larger wafer sizes, either 200mm or 300mm depending on device type.
With many specialty devices scaling to larger wafer sizes, the semiconductor industry faces new challenges in process control. After all, specialty devices are known for delivering specialized features or capabilities based on a unique process step or material that often requires a customized inspection and metrology solution.
To optimize the manufacturing process, real-time process control —powered by data analytics and software —has become an indispensable requirement in specialty device fabrication. To scale specialty technologies for high-volume manufacturing, manufacturers need integrated solutions and specialty-focused platforms offering flexibility, precision, and automation across multiple wafer sizes.
In this three-part blog series, we will begin by discussing one of the most important trends in specialty devices, the transition to larger wafer sizes and what this means for specific devices. The following blogs will focus on the challenges facing the manufacturing of specialty devices and the solutions addressing these challenges.
From Niche Applications to Mainstream Products
Originally, specialty devices were referred to as More-than-Moore devices because the use of these devices went beyond the simple node scaling of traditional CMOS devices. They also were being enabled by one or more “specialty” materials or process steps. In fact, the semiconductor industry did not start using the term “specialty devices” until these devices transitioned from niche applications to mainstream products and high-volume production.
But what exactly are the benefits of these specialty materials? Let’s consider the case of specialty power devices.
The compound semiconductors used in power specialty devices, SiC and GaN, can handle high voltages more efficiently than traditional Si. They provide the ability to switch high voltages in increasingly smaller areas and at higher speeds than their silicon-based counterparts. They do this without the elaborate cooling that would otherwise be required. As these materials scale to larger wafer sizes, they necessitate upgrades in wafer fabrication equipment, inspection, and metrology tools.
Transitioning Wafer Sizes
Specialty devices have long been the domain of 150mm and 200mm wafers, with CMOS image sensors (CIS) and power management devices being the exception. That’s all changing.
On the compound semiconductor front, the high demand for GaN-based high-power, fast-switching technologies is motivating a wafer size transition from 200mm to 300mm while SiC power devices are transitioning from 150mm to 200mm in high-volume manufacturing. In addition, photonics technologies now span wafer sizes of 150mm to 300mm, and MEMS devices are offered at 300mm.
As more specialty device technologies move into high-volume manufacturing, we can expect to see a greater demand for 300mm silicon, glass, and compound semiconductor-based wafer applications. However, this transition to larger wafer sizes introduces unique challenges for each specialty device type. These devices and their challenges include:
MEMS: Larger substrates and diverse materials (Si, glass, thick metals) require tighter process control of etch depth and CD, feature height across bowed or warped wafers, and surface roughness.
SiC Power: As SiC power moves to 200mm, inspection and metrology must expand sampling, deal with increased crystal defects, and support device architecture transitions profiling complex trench MOSFETs (e.g., top/bottom CD) without killing throughput. Insufficient sampling on larger wafers creates blind spots that hurt yield and cost of ownership.
GaN Power: Moving GaN to 300mm wafers increases within-wafer variation, requiring more measurement points and precise control of trench/HEMT critical dimensions to maintain uniform performance, while dealing with increasingly brittle and bowed or warped materials.
Photonics and CPO: Co-packaged optics require metrology tools designed for die-to-die and wafer bonding (voids, Cu dishing, film variation), sub‑micron alignment, and warpage, which affects optical coupling on larger wafers and multi‑die assemblies.
CIS: CIS stacks drive high sampling density for overlay and CD uniformity. These stacks require integrated chemical mechanical planarization metrology and analytical tools to catch excursions quickly as die counts and wafer diameters increase.
To meet these challenges and others, manufacturers need upgraded metrology and inspection tools, many of which will come from suppliers with a long-standing relationship with specialty technologies. These suppliers are best prepared to meet the wafer handling, on-wafer materials, and cost-of-ownership requirements that have become synonymous with the specialty device markets.
Conclusion
The emergence of specialty devices as a vibrant market of their own is driven by the increasing complexity and functionality of end products. Even in mature markets, such as smartphone and automotive, manufacturers continue to innovate by adding new features, which, in turn, fuels demand for additional specialty devices.
In our next blog, we will further explore the many challenges facing each type of specialty device. We hope you join us as we discuss those challenges and, in part three of our series, the solutions that are available in the specialty space today.
Christopher Haire is a marketing content specialist at Onto Innovation and a former business journalist.
We’d love to connect with you.
Looking to learn more about our innovative solutions and capabilities? Our team of experts is ready to assist you. Reach out today and let’s starts a conversation about how we can help you achieve your goals.
"*" indicates required fields
The Dragonfly G5 system is engineered for inline process control of leading-edge advanced packaging technologies. As the latest generation pattern inspection system in the Dragonfly series, it delivers unparalleled accuracy in detecting submicron defects and performing high-resolution 3D measurements.
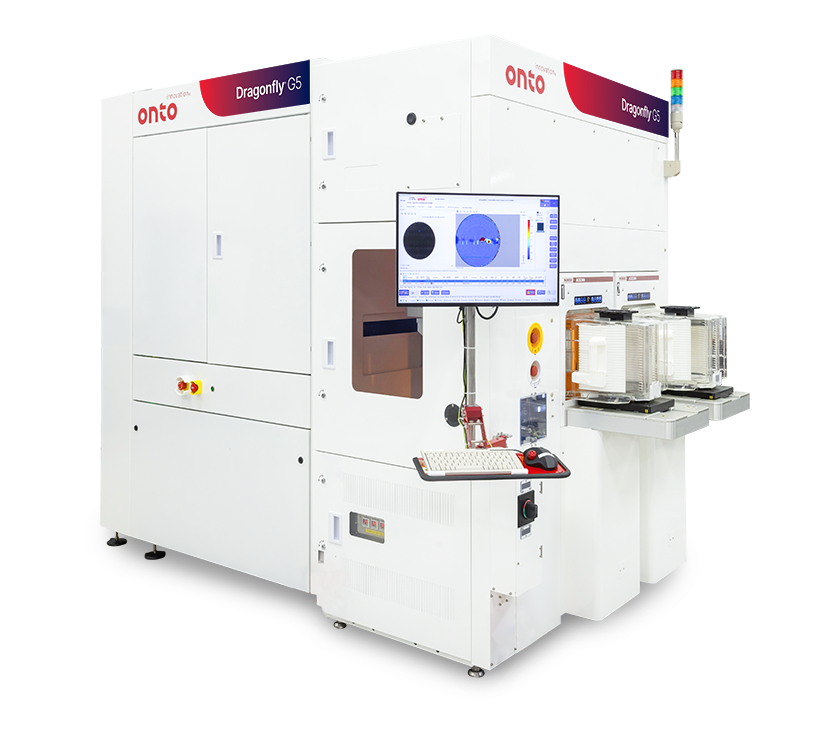
Designed to meet the demands of advanced semiconductor technologies, the Dragonfly G5 system is purpose-built to deliver high-performance, reliable inspection and metrology across complex heterogeneous integration processes. Leveraging next generation high speed line scan 2D imaging and custom-engineered objectives, the system achieves over 3X throughput improvement compared to its predecessor, with submicron sensitivity down to 150nm.
Continuing the legacy of innovation, the Dragonfly G5 system introduces a multi-angle illumination channel that significantly improves signal-to-noise ratio for faint defect detection. Combined with powerful AI-driven algorithms, it enhances both the detectability and classification of critical, yield-impacting defects–empowering fabs to maintain quality and accelerate time-to-yield.
The Dragonfly G5 system expands process control flexibility for wafer-to-wafer and die-to-wafer bonding by integrating high-speed IR imaging to detect sub-surface defects. It incorporates the latest generation of 3Di™ technology, extending bump height metrology capabilities to support next-generation microbumps essential for 3D integration. This enables additional inspection and metrology touchpoints across increasingly complex packaging architectures.




Hybrid bonding enables ultra-dense 3D memory interconnects with up to 1,000x more connections than microbumps. Achieving high yield requires stringent process control, including monitoring topography and detecting particles, cracks and voids. Measuring dishing in copper pads provides valuable insight into surface conditions. Together, these process control insights contribute to improved device reliability and performance.
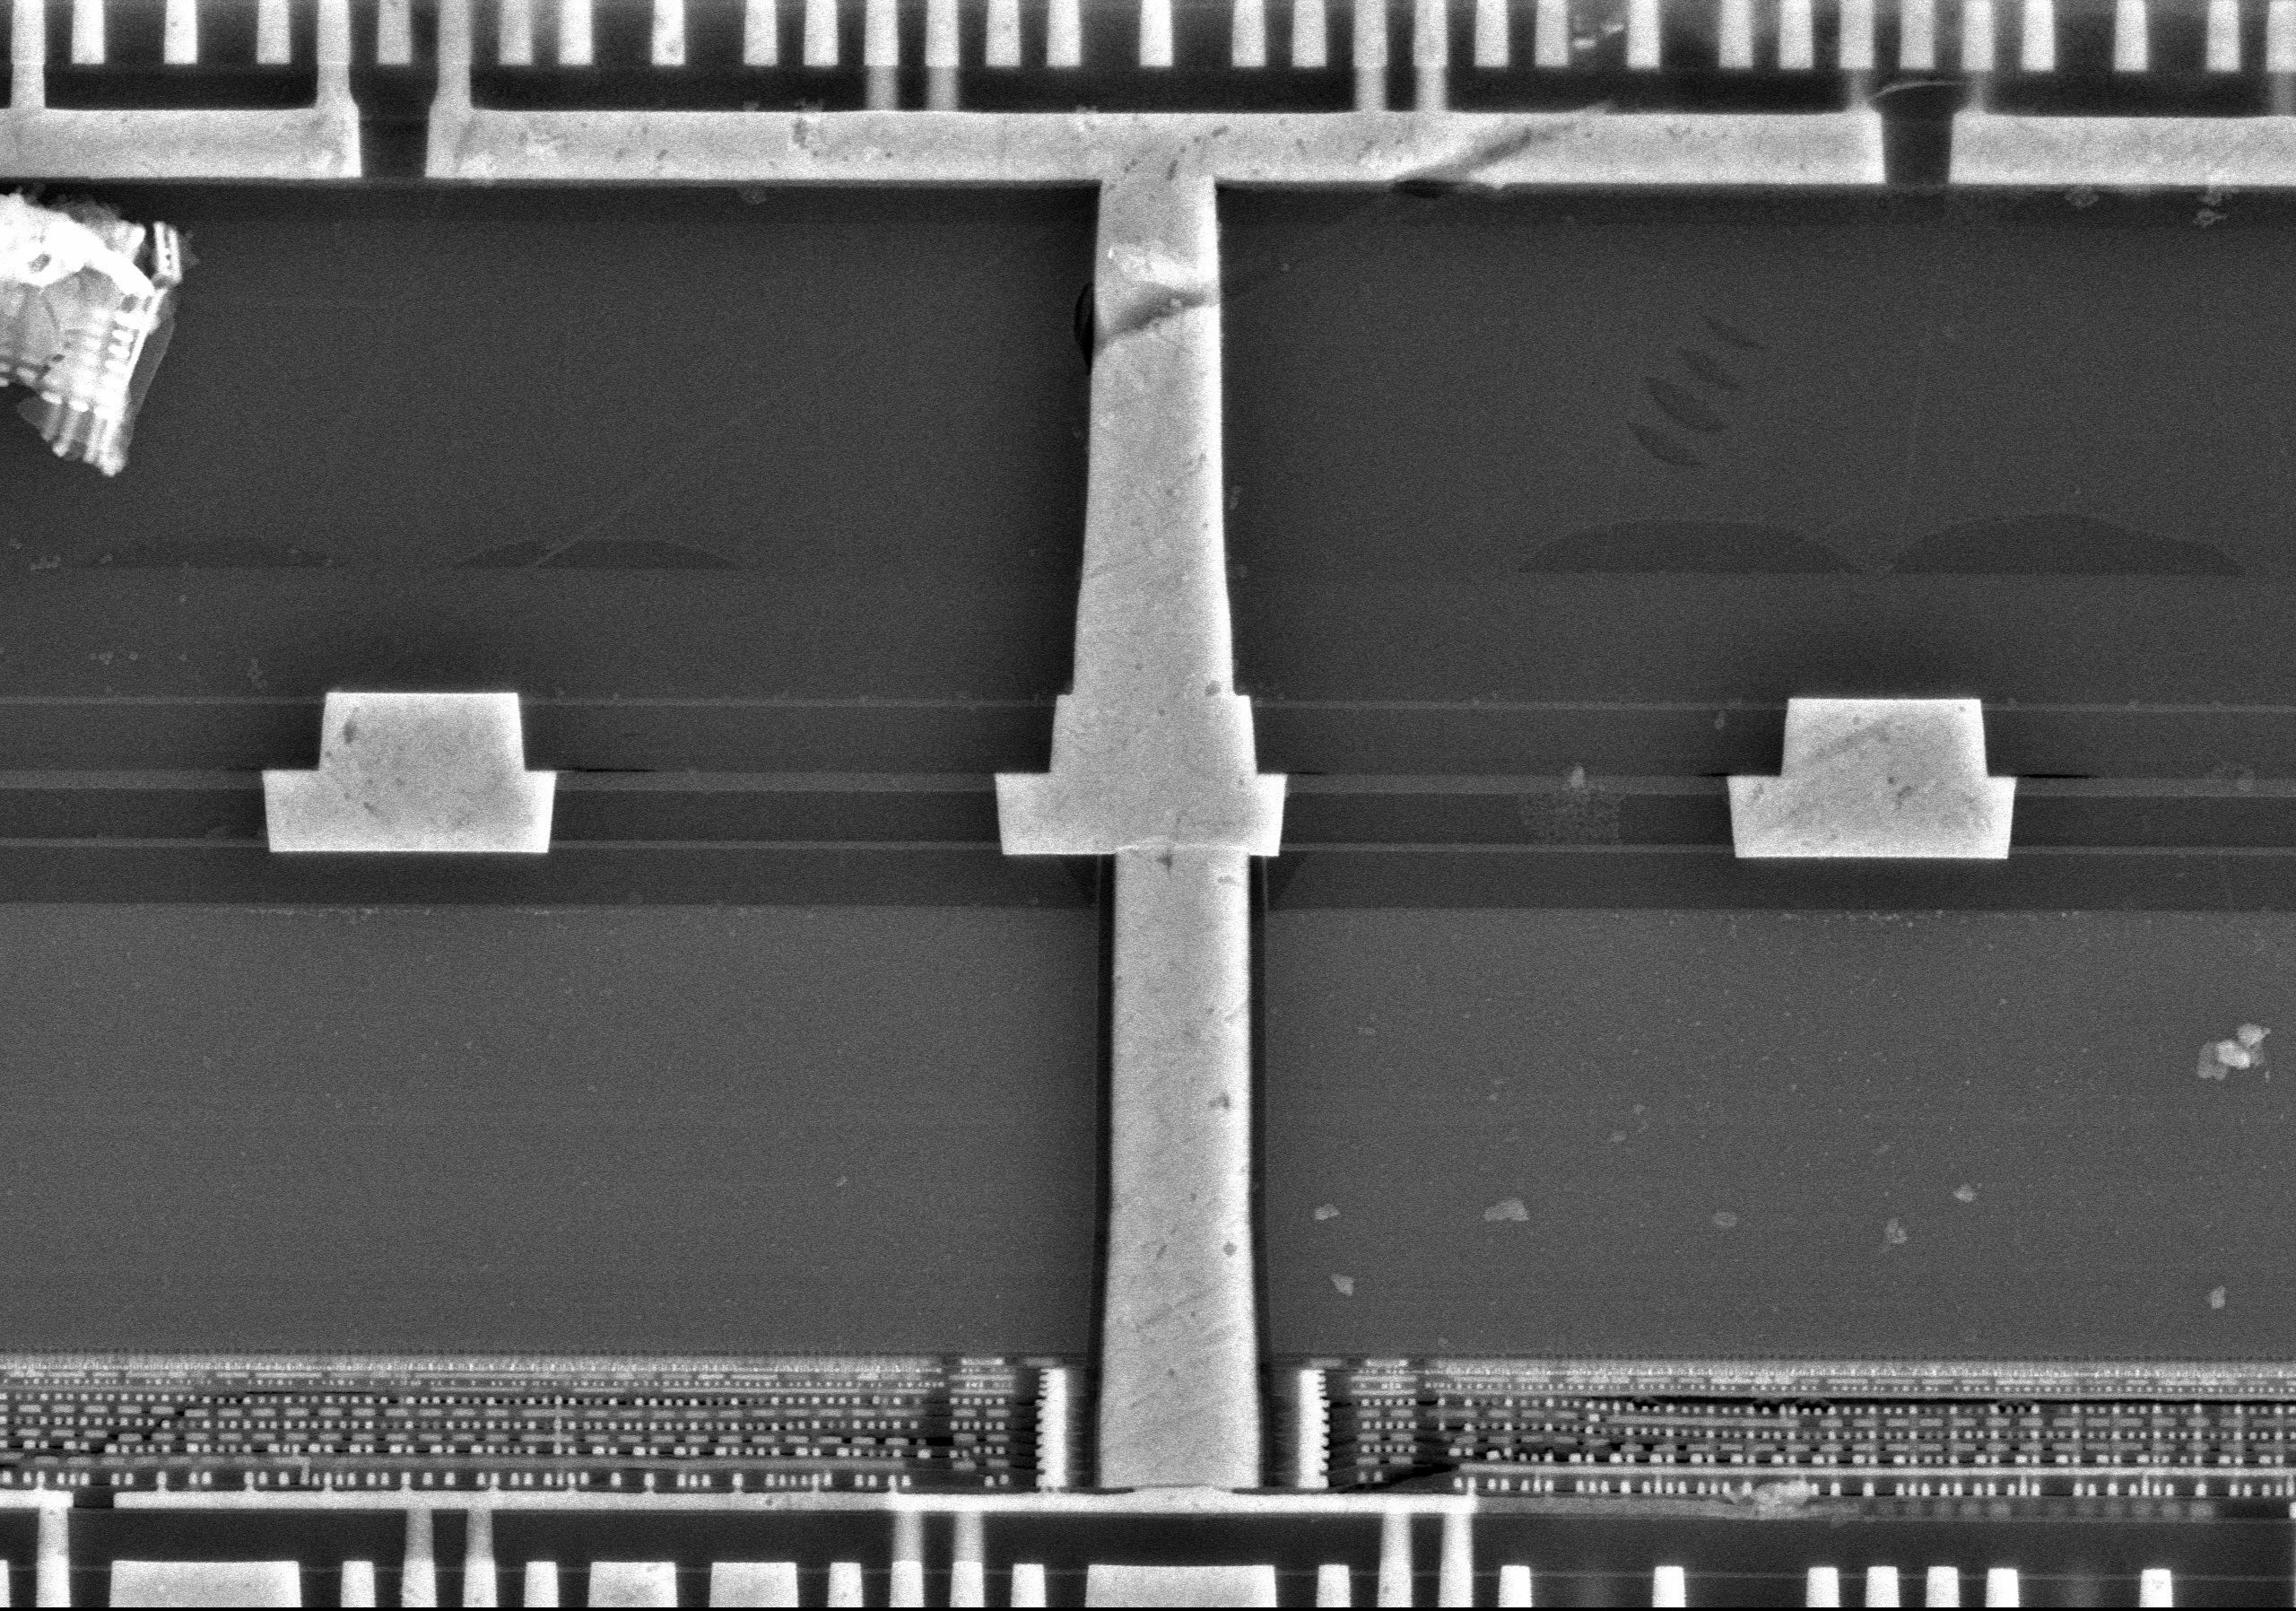
As demand grows for high-performance computing (HPC) and AI-driven applications, manufacturers are turning to hybrid bonding to enable the ultra-dense 3D integration required for next-generation chip architectures. This advanced packaging technology presents significant process challenges. Surface preparation must be precisely controlled to eliminate particles, excess recess, and copper pad dishing, all of which can compromise bond quality. During pre-annealing, particle-induced gaps and wide bonding gaps can prevent proper wafer contact. Post-annealing, the formation of dielectric and metal voids introduces further risks to electrical performance and long-term reliability.
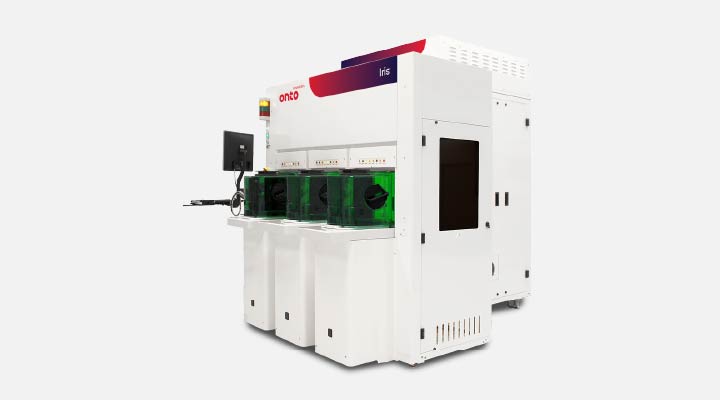
The Iris S system is a versatile platform solution for the advanced packaging and specialty market, supporting 150mm, 200mm and 300mm wafers. It provides thin and thick film, OCD and wafer bow and film stress measurements.
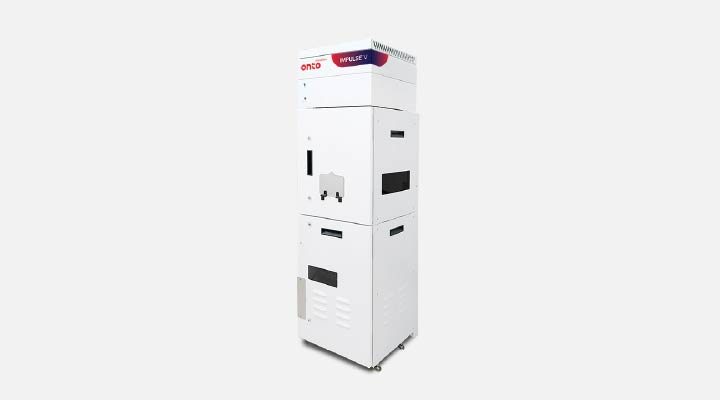
The IMPULSE V system helps to advance CMP processing with enhanced wavefront technology and AI-driven analytics, delivering over 2X precision improvement and faster solutions, crucial for next-gen semiconductor manufacturing demands.
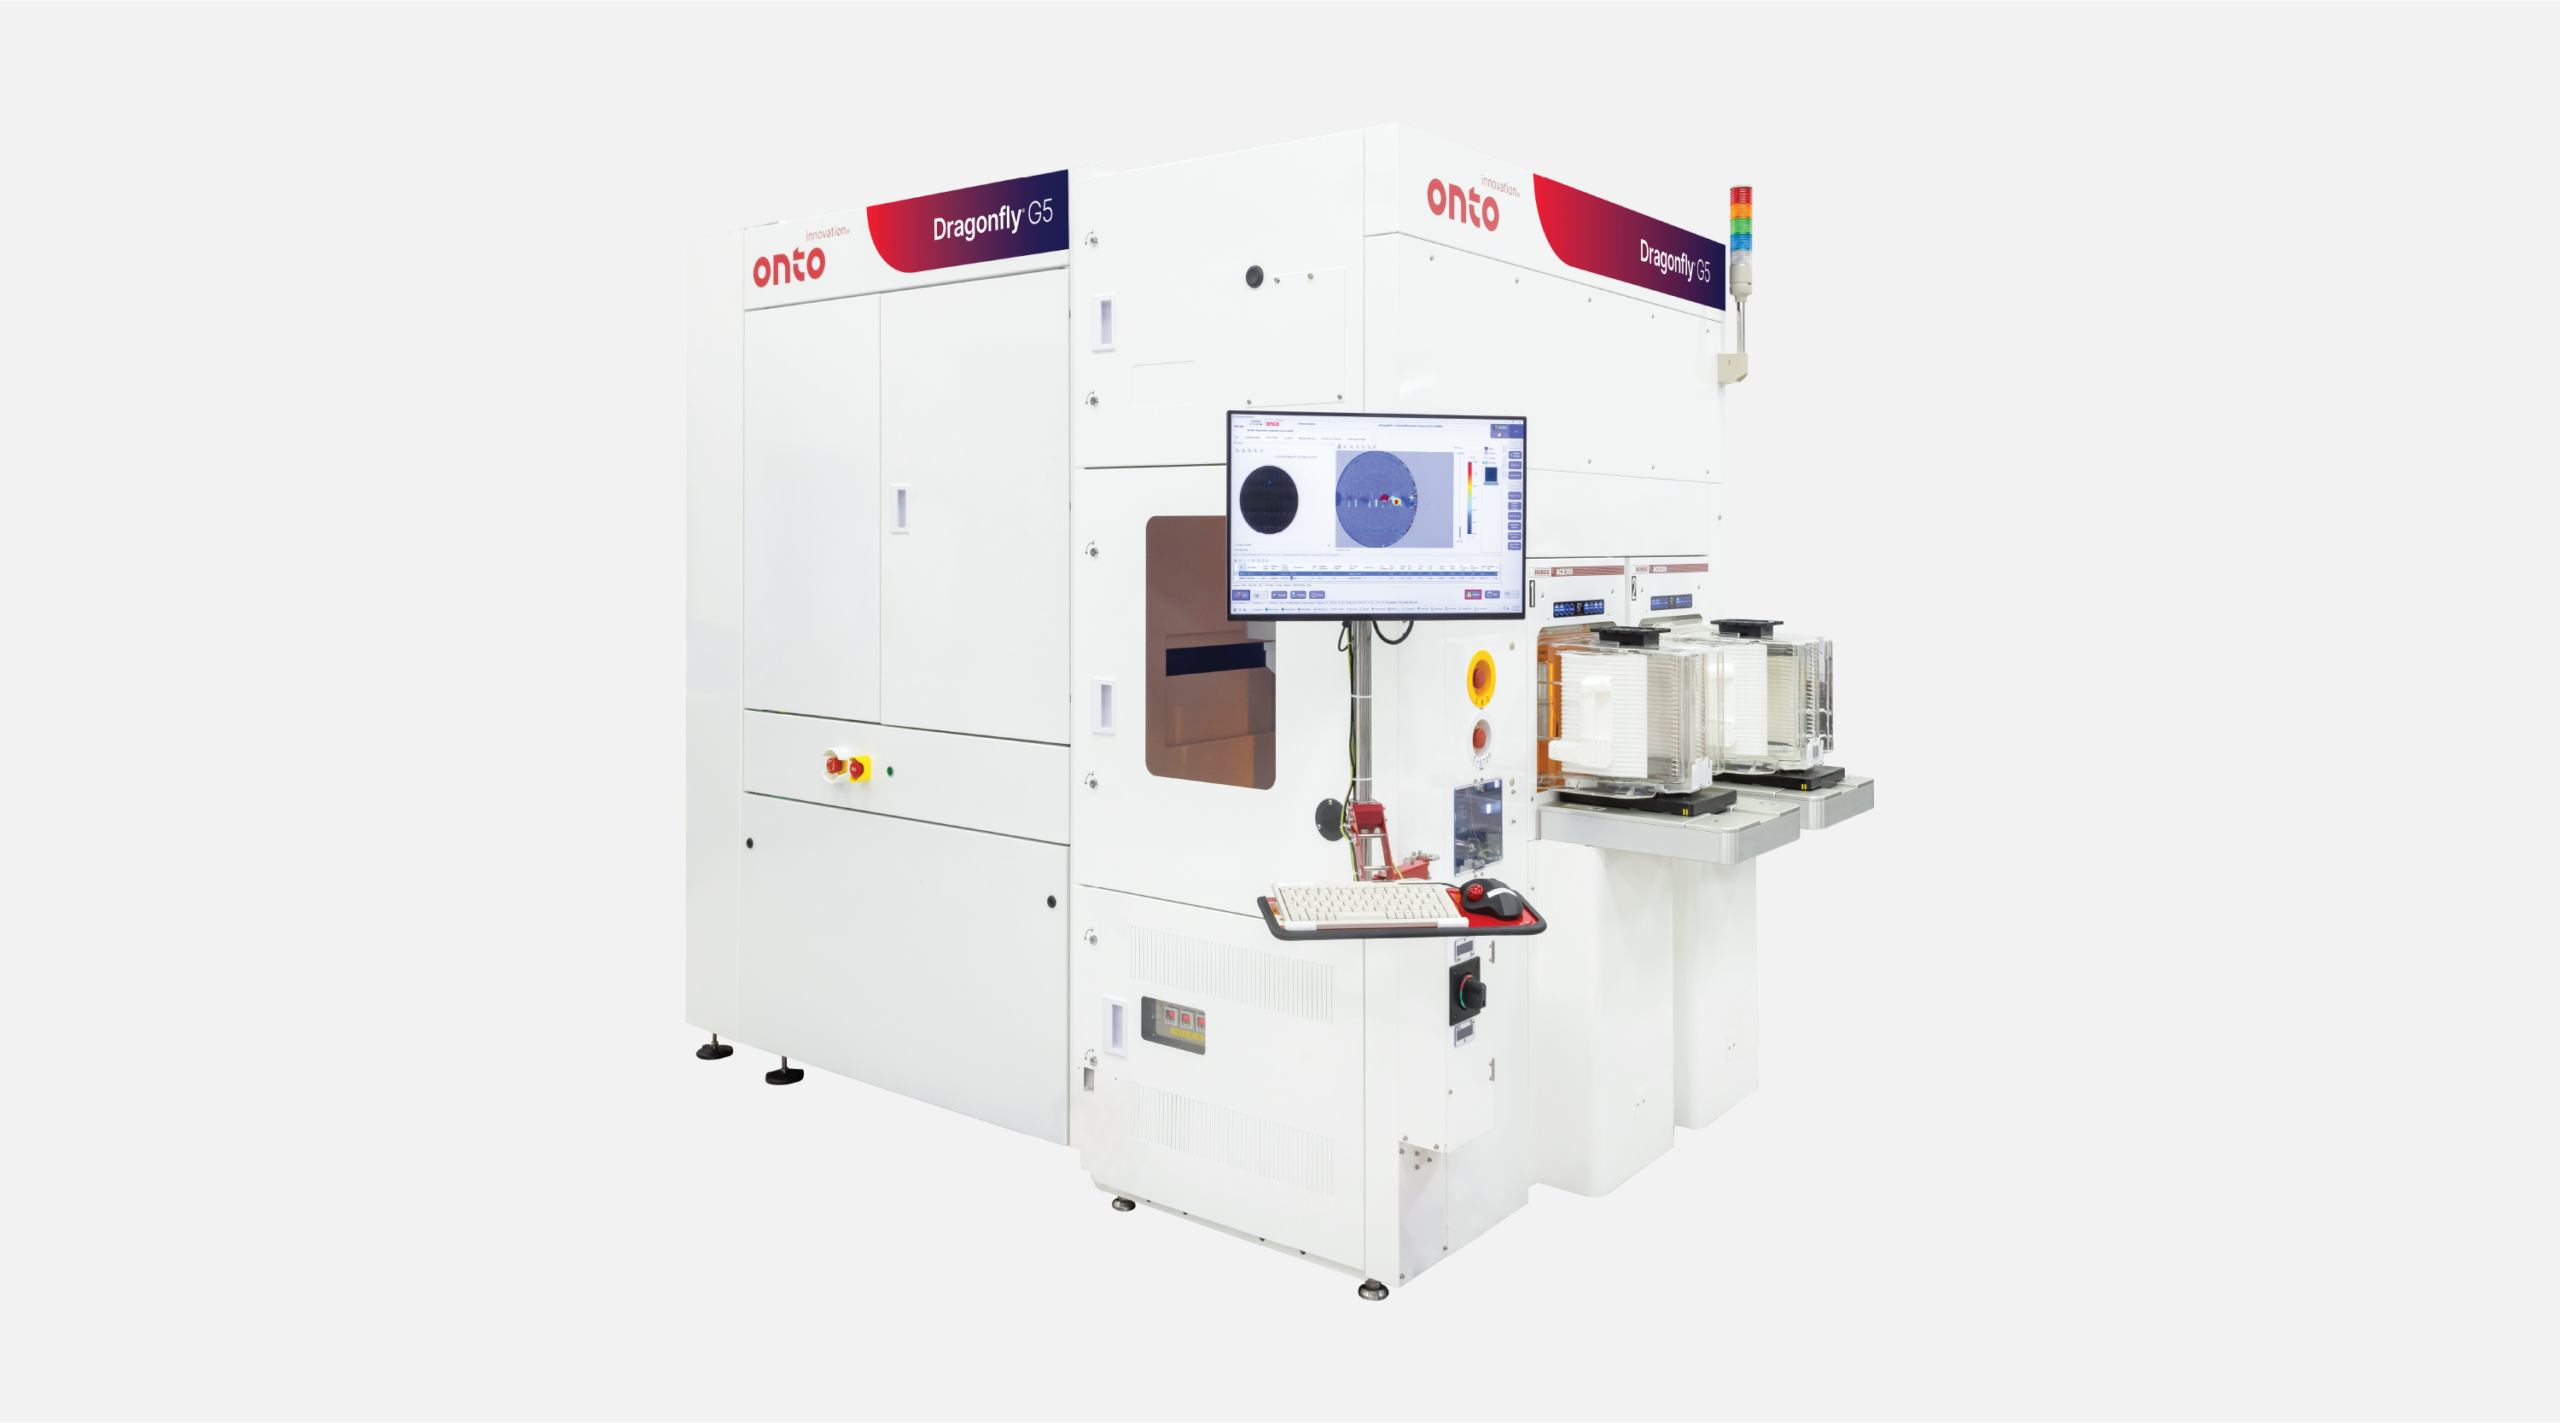
The Dragonfly G5 system is engineered for inline process control of leading-edge advanced packaging technologies. As the latest generation pattern inspection system in the Dragonfly series, it delivers unparalleled accuracy in detecting submicron defects and performing high-resolution 3D measurements.
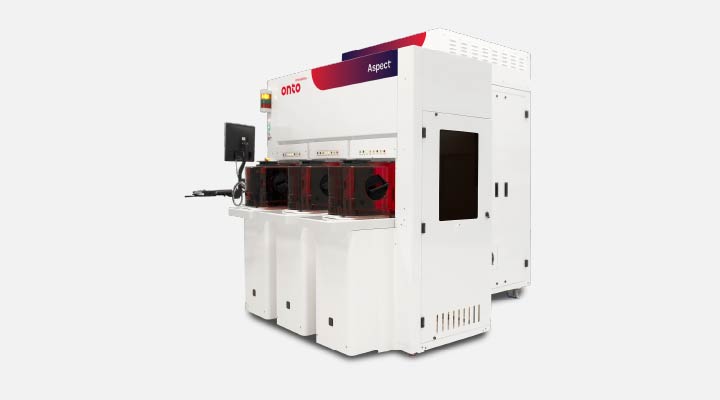
The Aspect System is a revolutionary in-line, non-destructive infrared optical critical dimension (IRCD) system measuring Z-dimension profiling of high aspect ratio structures to enable critical process control. It meets the needs of leading-edge customers with its high speed and process coverage.
As your partner for innovative solutions, we’re always here for you.
Discover how our cutting-edge semiconductor solutions are engineered to meet your most complex challenges: delivering performance, reliability and innovation where it matters most.
"*" indicates required fields
Mid-infrared ellipsometry offers a powerful approach for non-destructive optical critical dimension (OCD) metrology in advanced semiconductor manufacturing. This technique supports in-line measurements of high aspect ratio structures, such as those found in 3D NAND memory devices. The incorporation of quantum cascade lasers and fast phase modulation allows rapid acquisition of Mueller matrix elements with high spatial resolution and sub- Å precision. Material-specific absorption in the mid-infrared range allows depth-resolved profiling of device structures, overcoming the limitations of conventional OCD. Rigorous coupled wave analysis is used to extract structural parameters from the measured spectra. Agreement with destructive reference metrology has been demonstrated on a variety of structures. The ability to measure multiple Mueller elements further enhances characterization of complex geometries, making mid-infrared ellipsometry a valuable tool for process control in semiconductor fabrication.
This article may be downloaded for personal use only. Any other use requires prior permission of the author and AIP Publishing. This article appeared in Journal of Applied Physics (Vol.139, Issue 7) and may be found at https://doi.org/10.1063/5.0310009
DOI: 10.1063/5.0310009
We’d love to connect with you.
Looking to learn more about our innovative solutions and capabilities? Our team of experts is ready to assist you. Reach out today and let’s starts a conversation about how we can help you achieve your goals.
"*" indicates required fields