
Onto Innovation’s Monita Pau and Prasad Bachiraju contribute to the March 2024 edition of Semiconductor Digest.
Abstract
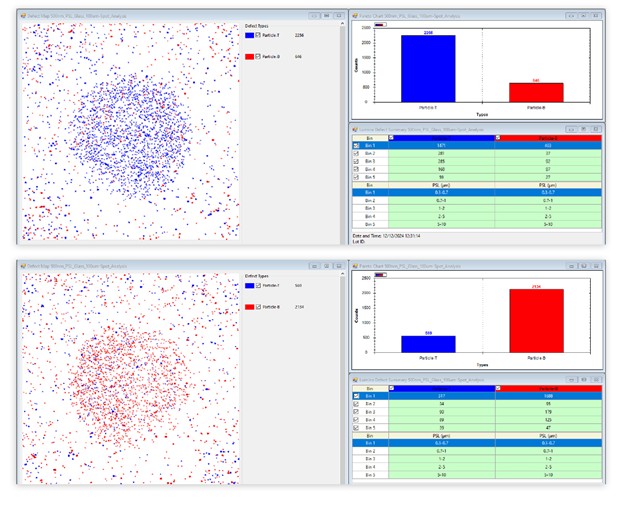
In traditional semiconductor packaging, manual defect review after automated optical inspection (AOI) is an arduous task for operators and engineers, involving review of both good and bad die. It is hard to avoid human errors when reviewing millions of defect images every day, and as a result, underkill or overkill of die can occur. Automatic defect classification (ADC) can reduce the number of defect images that need to be reviewed by operators. The ADC process can also be integrated with AOI engines to reduce nuisance defect images to reduce AOI image capturing time. This paper will focus on how to utilize Onto Innovation’s TrueADC software product to build ADC classifiers using a multi-engine (ME) solution. The software supports CNN, DNN and KNN algorithms. The use of CNN and DNN are currently mainstream in the development of deep learning (DL) for ADC classification in the semiconductor industry. We will address how to improve classification by using multiple models in the classification process with unique algorithms. As a result, the user can achieve industry requirements with very demanding specifications, like high accuracy, high purity, and high classification rate with very low escape rates.
Abstract
DRAM storage node profile measurement during high aspect ratio (HAR) etch has been one of the most challenging metrology steps. DRAM storage node profile affects refresh time and device electric quality. So, controlling this profile is one of the key challenges. Conventional 3D modeling in Optical Critical Dimension (OCD) metrology has typically used multiple cylinder stacks. This method cannot provide an accurate model and computed spectrum through the RCWA engine. This means we need a more accurate model. In this paper, we used hyper-profile to accurately measure a hole profile for better process control. Hyper-profile uses a polynomial to describe the smooth shape of a hole profile, which is much closer to the real product and provides a more accurate computed spectrum. With hyper -profile, a continuous storage node hole profile and managed CD correlation are achieved. It can maintain the same profile complexity with less degree of freedom, reducing the model uncertainty and ensuring more robust regression. On the other hand, as the metrology error budget becomes stricter and the process variation cycle is increasing, the OCD based model-guided machine learning (MGML) approach can provide a faster solution turnaround time with more accurate measurements than either pure OCD or pure ML approaches. It also can better decorrelate profile CDs and achieve more robust profile monitoring. In this paper, we will demonstrate the above benefits of hyper -profile and MGML in the DRAM storage node application.
Abstract
As scaling in semiconductor devices continues, the aspect ratios of deep trench isolation (DTI) structures have increased. DTI structures are used in power devices, power management ICs and image sensors as a method to isolate active devices by reducing crosstalk, parasitic capacitance, latch-up and allowing for an increase breakdown voltage of active devices. Measurement of these structures in high volume manufacturing (HVM), with non-destructive technology, has mostly been limited to the depth and top width of the DTI structure, while the bottom width (BCD) has not been able to be reliably measured. Here we present two different optical metrologies, “conventional” OCD and IRCD, that operate in the UV-VIS-NIR and MIR region of the electromagnetic spectrum, respectively, and discuss the measurability of DTI sidewall profile, bottom width, and depth in BCD (Bipolar CMOS DMOS) power management IC devices for each method at various pitches and line to space ratios. Experimental data will be presented showing sensitivity and discrimination of IRCD to a DOE specifically on the bottom width for three different structures.
Abstract
Fourier Transform Infrared spectroscopy offers inline solutions for chemical bonding, epi thickness, and trench depth measurements. Through optical modeling of the transmission or reflectance spectra, information about the electronic structure and chemical composition may be obtained, which can be used for process control and monitoring. In this article, we demonstrate the measurement capabilities of FTIR for the hydrogen bonding in cell silicon nitride and amorphous carbon hard masks (ACHM), which are used for 3D NAND fabrication. For cell silicon nitride, deconvolution of the spectra allows differentiation between individual peaks corresponding to Si-N, Si-H, N-H, Si-O, and Si-OH bonds. This differentiation identifies wafers with varying hydrogen content and distinct processes. Similarly, for ACHM, peak areas related to sp2 C-H bonds and aromatic C=C bending reveals the hydrogen skew conditions in three wafers. Notably, a linear relationship between high broadband absorption and low C-H bonds (and aromatic C=C) peak area is observed. The measurements exhibit good repeatability across ultrathin silicon nitride and thick ACHM samples. We believe the technique can be valuable for compositional process control, considering the significance of hydrogen content in cell nitride performance and endurance, as well as the influence of hydrogen content and carbon sp2/sp3 ratio on selective etch ratios in dry etch processes involving ACHM and mechanical properties of the films.
You’ve read the reports: the memory market is floundering as the semiconductor industry moves through another scarcity/surplus cycle.
Be that as it may, innovation is happening as the industry continues to pursue increasingly higher three-dimensional stacks, with 3D NAND stacks taller than 200 layers entering production.
However, there are challenges. Among those: conventional optical critical dimension (OCD) metrology systems have difficultly measuring the tungsten (W) recess in the wordline (WL) slit following the replacement gate step. This is particularly a problem as high-aspect ratio (HAR) stacks reach 96 layers or higher. For manufacturers, the ability to measure the W recess is critical. Under-etching the W replacement gates in the recess can cause wordlines to short, while over-etching the W gates can damage cells or cause a short from the wordline to the source line.